
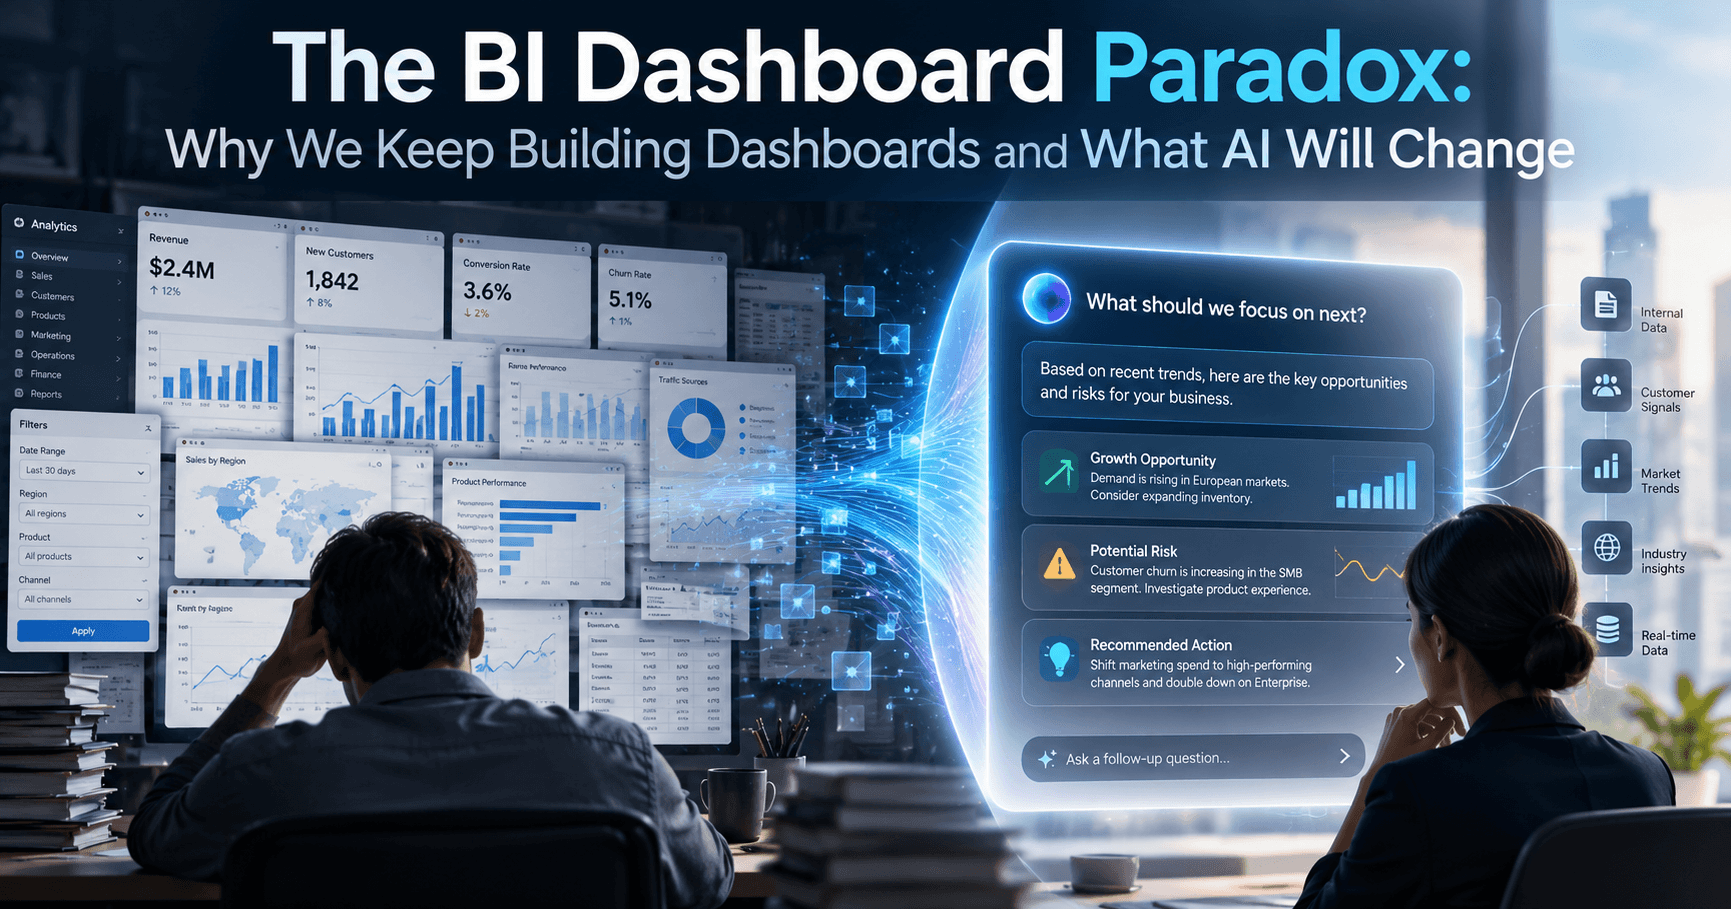
The BI Dashboard Paradox: Why We Keep Building Dashboards and What AI Will Change
By @Jin5 min read
Why is BI Dashboard So Popular in Traditional BI Era?
If you work in a data team, you are probably familiar with this situation. A business department needs to understand something about its performance. They contact the data team and asks for a dashboard.
The data team gathers requirements, identifies the necessary data sources, builds a data model, creates visualizations in Power BI or Tableau, and publishes the dashboard. The business users review it and request a few adjustments. Finally, the dashboard goes live.
Everyone is happy. The project is completed. THEN.. A few weeks later, another request arrives.
This workflow has been the standard way of delivering BI for years. But why did Dashboards become the default solution to so many different business problems? I believe there are several reasons.
- dashboards make data accessible to people who cannot write SQL.
- dashboards make analytical work reusable: A data analyst might spend several days creating a report, but once published, hundreds of employees can access the same information.
- dashboards standardize business metrics: When designed properly, a dashboard allows different departments to work with consistent KPI definitions.
- dashboards are tangible deliverables: It is easy to demonstrate that a project has been completed. It is much harder to demonstrate that a team has improved the quality of business decisions.
For traditional BI, dashboards were an efficient way to turn technical data work into a scalable, visible product.
But delivering information is not the same as delivering business value.
The Fundamental Limitations of Traditional Dashboards
A dashboard can only anticipate a limited number of questions
Imagine a procurement department wants to understand its purchasing behavior. The data team builds a dashboard displaying total purchasing volume, spending by supplier, catalog versus non-catalog orders, and monthly trends. The dashboard initially answers most of the department's questions.
But soon, someone asks: "Can we compare purchasing behavior between different business units?"
Another person asks: "Can we exclude certain types of orders from this KPI?"
Each question may require an additional measure, visualization, filter, or even a change to the underlying data model. Of course, modern BI tools support interactive filtering, drill-down, and drill-through capabilities. But these interactions generally operate within a structure that someone has designed in advance.
Business questions are almost unlimited. Dashboard structures are not.
To much information
When business users cannot find the information they need, the natural reaction is to add another visualization. Over time, dashboards become increasingly complicated.
More KPIs. More filters. More pages. More buttons. Eventually, users may struggle to understand where to look.
I find this slightly ironic. The purpose of a dashboard is to make data easier to understand, but adding more information can make it harder to use.
Sometimes, a business user doesn't need another chart. They simply need someone to explain what changed and why it matters.
User have to actively looking for problems
A traditional dashboard is usually a passive tool. The data is available, but someone needs to open the dashboard, inspect the numbers, recognize an unusual pattern, and decide whether to investigate further.
This creates a fundamental dependency: The system provides information, but the human is responsible for discovering the problem.
In a large organization, where employees are already overwhelmed by emails, meetings, and operational responsibilities, that is a significant limitation.
Why Dashboard Requirements Never End
Why do data teams keep receiving dashboard requests, even after building so many dashboards? I think the problem is partly related to how organizations define requirements.
A typical workflow looks like this: Business problem → Business request → Data team → Dashboard delivery
But somewhere in this process, the original business problem is often replaced by a proposed solution. For example, a business manager notices that purchasing costs are increasing.
The real question is: "Why are purchasing costs increasing, and what can we do about it?" But the request received by the data team might be: "Please add a supplier cost comparison to the dashboard."
The data team implements the visualization. The requirement is completed. However, the business problem may remain unresolved. A new chart might help reveal these factors, but the chart itself does not make the decision.
And this is where the cycle begins: The business team looks at the new visualization, discovers another question, and submits another request. More requirements lead to more dashboards, which lead to more questions and more requirements.
This creates what I would call a dashboard requirement factory.
The problem isn't that business users ask too many questions. The problem is that data teams are often asked to implement predefined solutions rather than help investigate the underlying business problems.
AI Makes Execution Cheaper, but Judgment More Valuable
AI is already changing how data professionals work.
Tasks such as writing SQL, generating DAX measures, creating visualizations, documenting models, and exploring datasets can increasingly be assisted by AI. The cost of implementing certain analytical requests is decreasing.
In the past, business users might hesitate before requesting a new dashboard because they knew it could take weeks to deliver. But with AI, creating a draft report or generating an analysis may take minutes. So why not request ten different versions? Demand for it will increase.
This creates a new challenge for data teams. The bottleneck moves from technical implementation toward deciding which questions deserve attention.
AI can help us build almost anything faster. But should we build it? Will anyone use it? Will it lead to a better decision?
What Will Replace the Traditional BI Dashboard?
I don't think the future of BI is simply replacing dashboards with Chatbots or sending users more automated notifications. Traditional BI tools like Power BI and Tableau already support alerts when certain KPIs reach predefined thresholds. The real limitation is that these KPIs are usually monitored separately, and users still need to investigate what happened, why it happened, and whether it actually matters.
I believe AI-powered BI should move beyond monitoring individual KPIs toward understanding broader business goals.
Take a procurement department as an example. The ultimate goal isn't to increase or decrease a particular KPI. It's to improve overall purchasing performance. Metrics such as spending, transaction volume, purchasing categories, and catalog purchasing rates are tools for understanding that performance, not goals in themselves.
Instead of monitoring each KPI independently, AI could connect them, understand their relationships, and evaluate changes in the context of the broader business objective. A sudden increase in spending, for example, might be perfectly normal if purchasing volume also increased. Not every fluctuation deserves an alert.
This is where AI could make a real difference: not just detecting changes, but deciding which changes deserve human attention.
When something genuinely requires attention, the system should go beyond a simple notification and explain three things: What happened? Why might it have happened? What should we do next? It should also provide supporting evidence and distinguish likely explanations from verified causes.
Related Articles
The newsletter
Data in the Age of AI
Exploring how AI is reshaping business intelligence, data architecture, and the way organizations work with data. Get new essays from @Jin delivered to your inbox.
Visit the publication on Substack →Add Comments
Comments
Loading comments...