
How to specify the data format when saving Excel via Python?
In this article we will solve the following questions:
1. how to use xlsxwriter to save Excel?
2. how to save multiple dataframes to worksheets using Python?
3. how do use Python to stylize the Excel formatting?
4. how to ensure that specific data types such as datetime, integer, string, and floating data are saved accurately when using Python and xlsxwriter to save a dataframe to Excel?
Question Description:
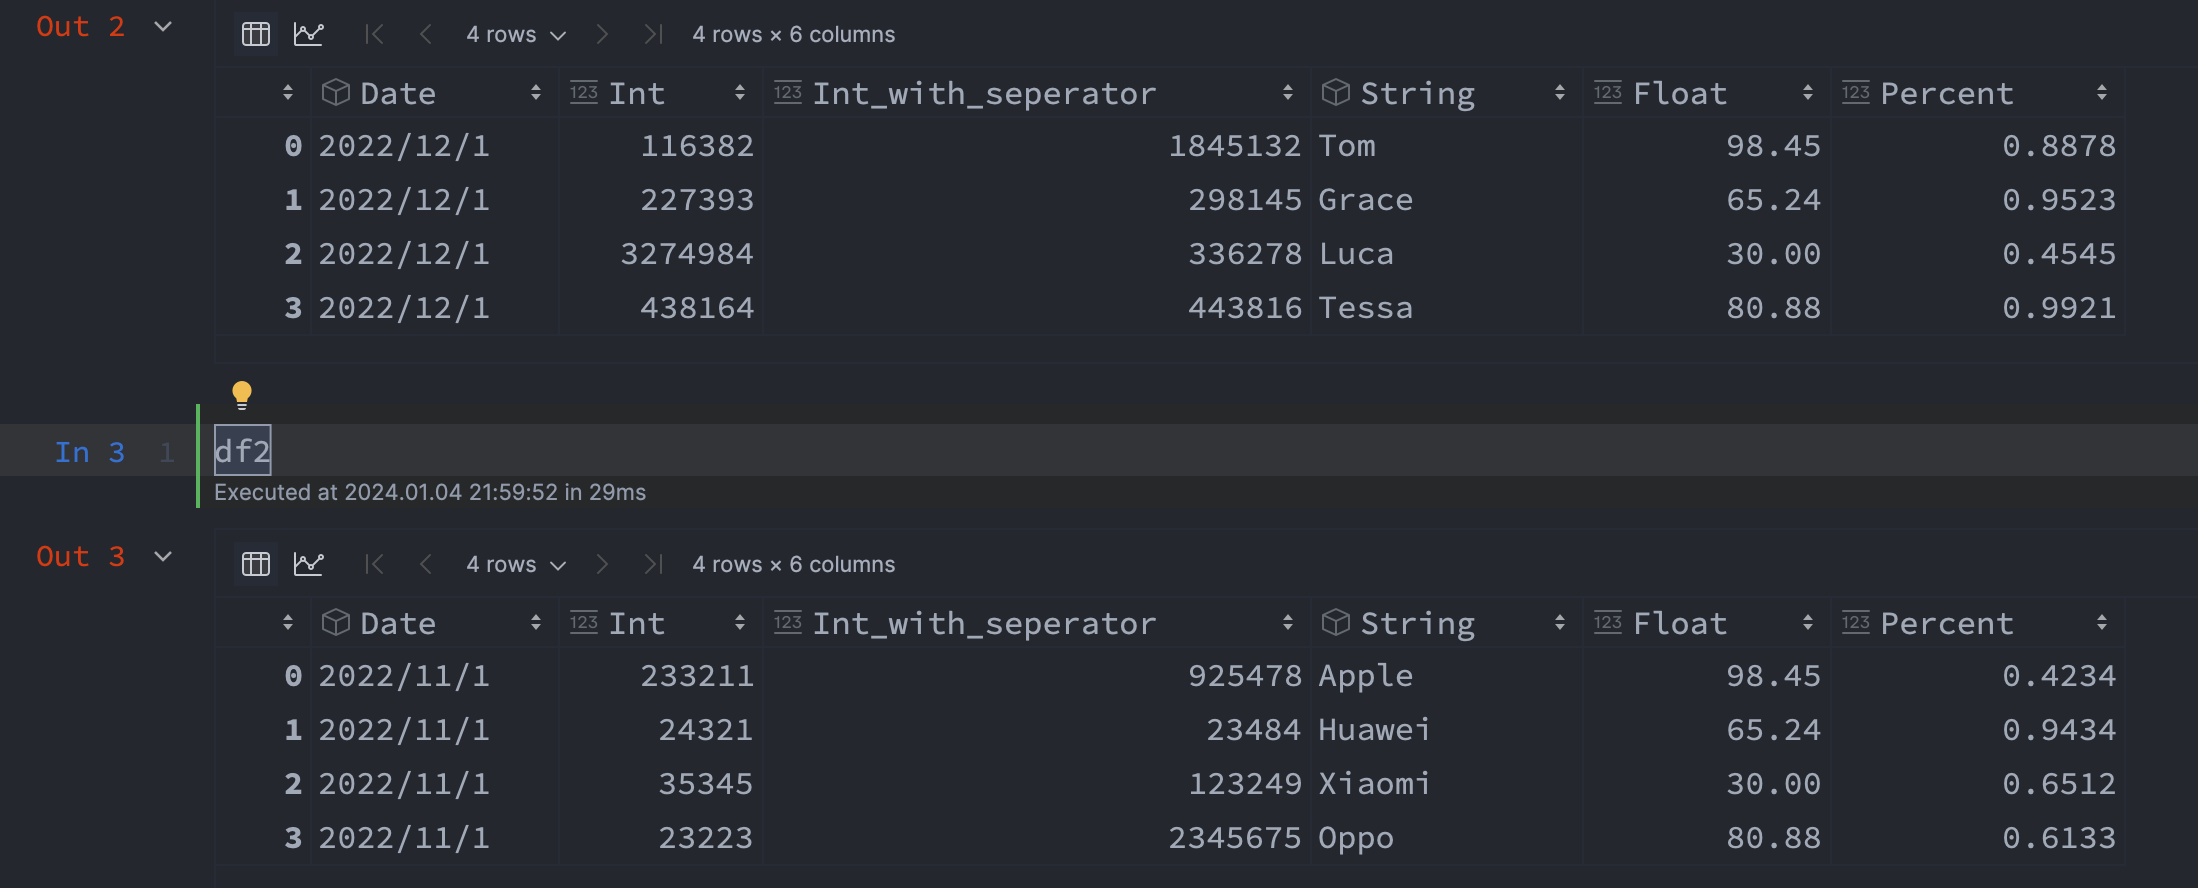
please imagine that you have the following 2 dataframes and you want to save them into one Excel file with different sheets and stylize the Excel formatting
Solution: Save Excel through xlsxwriter
1. import xlsxwriter package and create Excel file
use Workbook to create a new Excel file.
# import package
import xlsxwriter
# create excel file
workbook = xlsxwriter.Workbook("new_excel.xlsx")
2. create two sheets
use .add_worksheet to create a sheet because we have two dataframes that need to be saved, we have to create two sheets.
worksheet1 = workbook.add_worksheet('df1_sheet')
worksheet2 = workbook.add_worksheet('df2_sheet')
3. set header format and save the header
first, we set header format and use .write_row to save our header.
.write_row has four arguments, they are: worksheet.write_row(row, col, data, cell_format).
header_format = workbook.add_format({
 'valign': 'top',
 'fg_color': '#002060',
 'border': 1,
 'font_color': 'white'})
worksheet1.write_row(0, 0, df1.columns, header_format)
worksheet2.write_row(0, 0, df2.columns, header_format)
4. create some format
format.set_num_format():This method is used to define the numerical format of a number in Excel. It controls whether a number is displayed as an integer, a floating point number, a date, a currency value, or some other user-defined format.
The numerical format of a cell can be specified by using a format string or an index to one of Excel’s built-in formats, for more information you can check xlsxwriter-format
for example: 14 represents m/dd/yyyy, so format.set_num_format(14) = format.set_num_format('m/dd/yyyy')
# set datetime format "m/d/yy"
format_datetime = workbook.add_format({'border': 1})
format_datetime.set_num_format(14) # based on above table, 14 means "m/d/yy"
format_datetime.set_font_size(12) # set font size

# set General format
format_general = workbook.add_format({'border': 1})
format_general.set_num_format(0) # 0 means general
format_general.set_font_size(12)

# set integer format "0"
format_integer = workbook.add_format({'border': 1})
format_integer.set_num_format(1)
format_integer.set_font_size(12)

# set float format "0.00"
format_float = workbook.add_format({'border':1})
format_float.set_num_format(2)
format_float.set_font_size(12)

# set integer format with thousands separators "#,##0"
format_integer_separator = workbook.add_format({'border': 1})
format_integer_separator.set_num_format(3)
format_integer_separator.set_font_size(12)

# set percent format "0.00%"
format_percent = workbook.add_format({'border':1})
format_percent.set_num_format(10)
format_percent.set_font_size(12)
5. save the data into Excel with cell_format
the zero index row already saved our header, so we start from one index row(set the first argument to 1)
# .write_column(row, column, data, cell_format)

worksheet1.write_column(1, 0, df1.iloc[:, 0], format_datetime)
worksheet1.write_column(1, 1, df1.iloc[:, 1], format_integer)
worksheet1.write_column(1, 2, df1.iloc[:, 2], format_integer_separator)
worksheet1.write_column(1, 3, df1.iloc[:, 3], format_general)
worksheet1.write_column(1, 4, df1.iloc[:, 4], format_float)
worksheet1.write_column(1, 5, df1.iloc[:, 5], format_percent)
worksheet2.write_column(1, 0, df2.iloc[:, 0], format_datetime)
worksheet2.write_column(1, 1, df2.iloc[:, 1], format_integer)
worksheet2.write_column(1, 2, df2.iloc[:, 2], format_integer_separator)
worksheet2.write_column(1, 3, df2.iloc[:, 3], format_general)
worksheet2.write_column(1, 4, df2.iloc[:, 4], format_float)
worksheet2.write_column(1, 5, df2.iloc[:, 5], format_percent)
6. set column width
for a better display of the data, we can also use .set_column to set the column width.
worksheet1.set_column('A:A', 15)
worksheet1.set_column('B:B', 15)
worksheet1.set_column('C:C', 15)
worksheet1.set_column('D:D', 15)
worksheet1.set_column('E:E', 15)
worksheet1.set_column('F:F', 15)
worksheet2.set_column('A:A', 15)
worksheet2.set_column('B:B', 15)
worksheet2.set_column('C:C', 15)
worksheet2.set_column('D:D', 15)
worksheet2.set_column('E:E', 15)
worksheet2.set_column('F:F', 15)
7. finish
workbook.close()2024-01-04
Related Articles
- Use Python to Fetch Followers and Monitor Post Status on DEV.to
- How to Store JSON and XML in SQL Databases
- SQL Recursive Queries - Understanding Common Table Expressions (CTEs)
- Draw a Fish and Watch it Swim - Crazy Idea Create Viral Website
- Stop Using Spark for Your Small Data - Why Azure Functions is the Right Tool for the Job
Add Comments
Comments
Loading comments...